Visual Basic program "VB Gal MOND" - Description and operation
Introduction and Purpose
The purpose of the Visual Basic program "VB Gal Mond" is to demonstrate 2D galaxy simulation using MOND
For a copy of "VB Gal MOND.exe" select: VB Gal MOND.zip.
The program "VB Gal MOND" is base around the question: MOND - What is involved
For the background information about MOND go to:Gal_Mond.bas: Galaxy Simulation in 2 D with MOND
The initial purpose was to simulate a galaxy in 2D using Newton's Law. For background information goto: Program "Gal 2D.bas": Galaxy Simulation in 2 D
For more information goto: Implementation details
The Visual basic program program "VB Gal MOND" consits of 3 Forms (or displays):
- Control Form. This form is used to Start the program and to modify the parameters.
- Display Form. This form shows the results of the simulation in a graphical form.
- Print Form. This form shows the results in a table.
Operation - Control Form
Operation of the program is done from the Control Form.
 Picture 1A
|
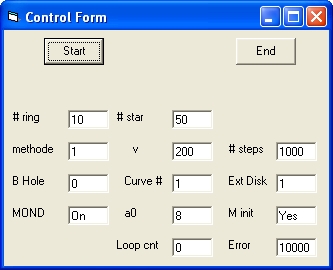
Picture 1A Shows the initial display.
This dispay shows 3 Commands: Start, End and Stop. This depends about were you are during program execution.
- The Start command is used to start the program
- The End command is used to terminate the program
- The Stop command is used to stop the simulation
After startup the Control Form shows 9 Parameters which can be selected: # ring,# star, methode , v , # steps , B Hole , Curve #, Ext Disk and MOND
- # ring # of rings with stars. Minimum # is 1, Maximum # is 50.
- # star # of stars per ring. Minimum number is 2. Maximum Number is 50.
To perform an actual simulation the total number of stars should not be more than 1000. See below.
- methode Integration method 1 = simple 2 = Runga Kutta (K1,K2,K3,K4).
- v Rotation speed v in km/sec. 100 is Minimum. 400 is Maximum
- # of steps per revolution. Minimum # is 100. Maximum is 10000
- Mass of Black hole in the centre in increments of 10^6 sun masses.
0 = No Black hole. 1 = Black Hole.
- Curve # Galaxy Rotation target curve #. There are four available.
- Ext Disk The standard value is 1 which means 60000 light years. The maximum value is 10.
- MOND
-
When MOND is Off Newton's Law is applied.
When Mond is On MOND is applied.
When MOND is selected the following 3 parameters are displayed:
- M min , a0 , Loop cnt and Error.
-
- a0 The cosmological constant. Standard value is 8
- Loop cnt and Error. Those two parameters are set during the "Mass Calulation phase"
As an operator the first thing you have to do is to modify the parameters and than to select the Start command.
During Program execution the following messages are possible:
- Too many Stars for mass calc (max 4000) 6000
-
When you get this message you have to reduce either the parameter # ring or # star in order that the mass calculation takes place.
- Too many Stars for simulation (max 1000) 2500
-
You can only get this message after the "mass calculation" phase
When you get this message you have to reduce either the parameter # ring or # star in order that the simulation can take place.
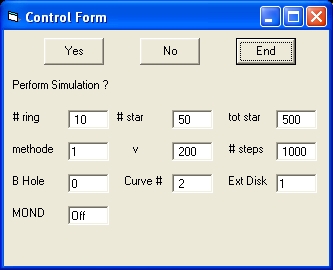
- Perform Simulation .
-
This message is displayed together with the following commands: Yes, No and End
The message is displayed after the end of the "Mass Calculation" phase. The Print Form shows the result of the whole start up process.
Select the Yes Command to start the simulation. Next the Stop Command is displayed, in order to stop the simulation
When the No Command is selected the massage Make Modification ? is displayed.
When any parameter is modified the Start Command is displayed.
 Picture 1B
|
In picture 1B Mond = Off and Curve = 2
- Continue ?
-
This message is displayed after the "Stop" Command is selected.
At the same time with this message 3 commands are displayed:
"Start", "End" and "Yes"
- When the "Yes" Command is selected the simulation continues.
- When the "Start" Command is selected the program starts from the beginning. Before selecting the "Start" Command certain parameters should be changed.
- Calculation Mass Distribution .
-
This message is diplayed as part of the "Mass Calculation" phase when the parameter "MOND" is On.
During this phase the paramers Loop and Error are updated.
The chance to observe this message is small because this phase is in most cases is very short.
- Make Modification ?
-
The purpose is that the operator should change at least one parameter in order to start a new simulation.
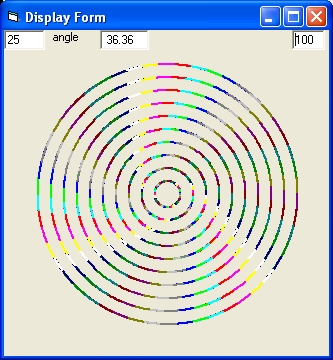
The "Display Form" shows the result of the simulation.
The top right corner shows a number. The starting value is 100. That means all the stars in each ring are displayed.
When the value is 1 only one star in each ring is displayed. This allows you to observe the movement of the stars in one particular direction.
When the value is 2, 2 stars in each ring are displayed.
 Picture 2A
|
 Picture 2B
|
Picture 2A shows the result of a simulation with the parameters of Picture 1A.
In picture 2A Mond = On and Curve = 1
|
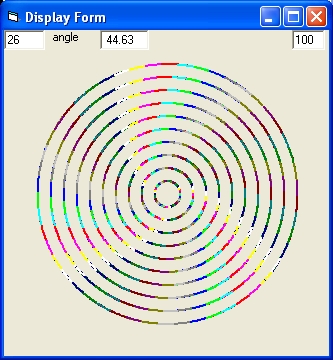
Picture 2B shows the result of a simulation with the parameters of Picture 1B.
In picture 2B Mond = Off and Curve = 2
|
When you compare Picture 2A with Picture 2B the left one is more Flat. The right one is slightly bended.
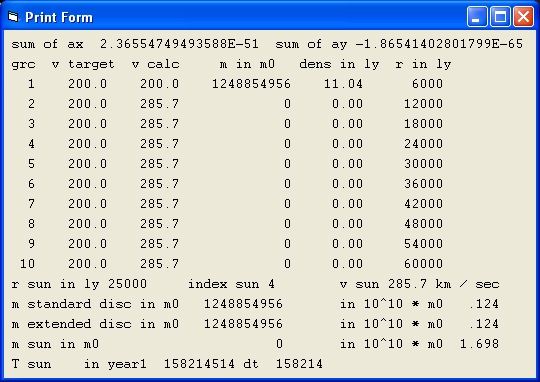
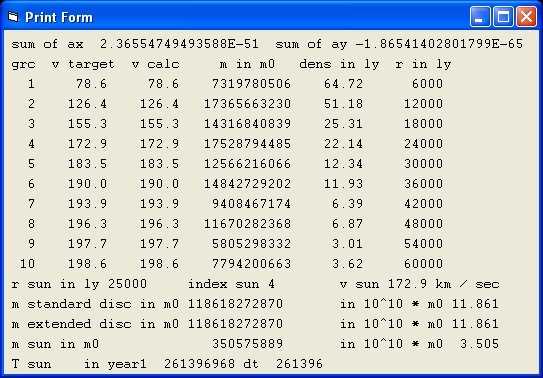
This Form shows the result of the simulation at the end of the "Mass Calculation" phase in six columns.
- Column 1 shows the ring #.
- Column 2 shows the target speed.
- Column 3 shows the calculated speed.
- Column 4 shows the total mass in sun masses
- Column 5 shows the density in sun masses
- Column 6 the radius in light years.
 Picture 3A
|
Picture 3A is shows the result of a simulation with the parameters of Picture 1A.
In picture 3A Mond = On and Curve = 1
What the results show is that there is no mass in the disc. This is a typical behavior to get a flat galaxy rotation curve with Mond. With Mond the rotation speed never decreases.
 Picture 3B
|
Picture 3B is shows the result of a simulation with the parameters of Picture 1B.
In picture 3B Mond = Off and Curve = 2
What the results show is that there is mass in the disc. This is a typical behavior for a galaxy rotation curve with Newton's Law. The rotation speed typical decreases at larger distances.
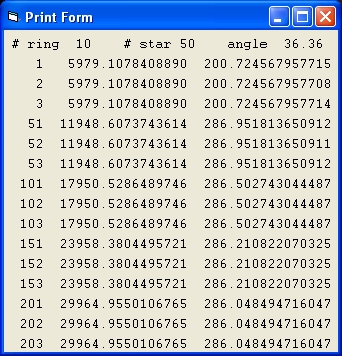
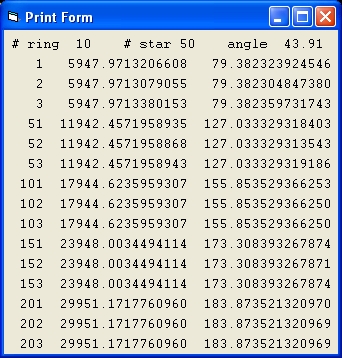
This display shows the numerical results during each simulation.
Picture 4A
|
Picture 4B
|
Picture 4A shows the result of a simulation with the same parameters of Picture 1A.
In picture 4A Mond = On and Curve = 1
|
Picture 4B shows the result of a simulation with the same parameters of Picture 1B.
In picture 4B Mond = Off and Curve = 2
|
- The lines starting with the numbers 1,2 and 3 show data of the first 3 stars of ring #1.
- The second column shows the distance for each of these 3 stars.
In Picture 4A the distance is identical which is a typical identification that the parameter MOND is On and the simulation is more stable.
In Picture 4B the distance is more different which is a typical identification that the parameter MOND is Off and the simulation is more unstable.
- The third column shows the velocity.
- The lines starting with the numbers 51,52 and 53 show data of the first 3 stars of ring #2.
- The lines starting with the numbers 101,102 and 103 show data of the first 3 stars of ring #3.
- When you compare the results of column 3 of Picture 4A with the third column of Picture 3A they are the same. The problem is that the values are higher than the target values. This is a problem with MOND.
- When you compare the results of column 3 of Picture 4B with the third column of Picture 3B they are the same. The results are also the same as the target values. This is the demonstration why Newton's Law is better than MOND.
Program Evaluation - Without simulation
The following are tests are all done without any real simulation.
Starting point are the standard parameters.
Ater the message:
- Perform Simulation ?
-
Select NO Command
The galaxy rotation curves 1,2,3, 4 and 5
The purpose of this test is to simulate the different galaxy rotation curves.
The only parameter to change is the curve #
200 |xxxxxxxxx                   *               x            **                           x
    |                     *                    x            *      *                       x
    |                 *                      x             *           *                  x
    |              *                       x              *                             x
    |             *                      x                *                         x
    0             *                    x                  *                  x
      curve 1           curve 2             curve 3           curve 4             curve 5

                             Galaxy Rotation Curves
| Curve # | Mond | loop counter | error | total mass |
| 1 | On | 57 | 257,14 | 1248854956 |
| 2 | On | 25 | 9,24 | 59198490 |
| 3 | On | 36 | 0,173 | 46095610 |
| 4 | On | 25 | 21,865 | 96574836 |
| 5 | On | 34 | 0,092 | 93288744 |
The parameter Loop counter shows the number of loops to calculate the lowest error value during the "mass calculation phase." The parameter Error shows this error value.
Galaxy rotation curve #3 is the easiest curve to simulate using MOND. The speed increases lineair.
Galaxy rotation curve #4 is the most difficult to simulate using MOND. Constant C4= 0.1
-
From the "Form Print" you can see that there is the large error between the target and the simulated galaxy curve.
The final target values are: 193.9 188.3 186.4 182.7 and 180.9 (decrease)
The final actual values are: 191.7 192.5 193.5 193.7 and 193.9 (flat)
The important lesson is: Galaxy rotation curves where there is a clear maximum speed and then the speed decreases can not be simulated using MOND
See below for more information about Curve #4, Specific the meaning of Constant C4,
-
Galaxy rotation curve #1 is the completely flat curve.
-
Observe calculated rotation curve has the values 200.0 285.7 285.7 285.7 etc.
Most important lesson: There is no mass in the disc
This raises an each more serious problem When you measure the speed of the disc of a galaxy as being flat, than you can not explain that using MOND, because in that case there is no matter in the flat disc
-
Galaxy rotation curves 1 and Black Hole
The purpose of these test is to observe the influence of a Black Hole
| Test | Curve # | v | BH | loop count | error | total mass |
| 1 | 1 | 140 | 0 | 55 | 180 | 299850080 |
| 2 | 1 | 200 | 1 | 57 | 255,35 | 1229539440 |
| 3 | 1 | 200 | 1500 | 69 | 184,96 | 2083760232 |
| 4 | 1 | 200 | 15000 | 1000 | 1,227 | 15000003873 |
- Observe rotation curve has the values 140.0 200.0 200.0 200.0 200.0 etc.
- Observe rotation curve has the values 200.2 285,1 285,1 285,1 285,1 etc.
- Observe rotation curve has the values 200.0 261.6 261.6 261.6 261.6 etc.
- Observe rotation curve has the values 200.2 200.3 200.4 200.4 200.4 etc.
The important lesson is: By introducing a large BH you can get a complete flat galaxy rotation curve with MOND
Galaxy rotation curve 1 and MOND versus Newton
| Test | Curve # | MOND | M Init | loop count | error | total mass |
| 1 | 1 | Off | | | | 111613713709 |
| 2 | 1 | On | Yes | 57 | 257,14 | 1248854956 |
| 3 | 1 | On | No | 10 | 35,863 | 116548964824 |
For test 1 the grv is: 200, 200, 200, 200, 200, 200, 200, 200, 200 and 200
For test 3 the grv is: 437, 706, 880, 1020, 1137, 1234,1319, 1385, 1440 and 1459
What can you learn from test 1 and 3 ?
- First, the main point is that the total mass and the mass distribution is identical but the rotation curve not
With Newton's Law the curve is flat but with MOND the speed increases almost lineair
- Secondly that the rotation curves, assuming the same baryonic mass distribution of a simulation based on Newton's Law compared to MOND are totally different.
Galaxy rotation curve 2 and a0 - fixed curve
The purpose of this test is to observe what happens if you MOND and the only parameter that is changed is a0. The rotation curve is the same.
| Test | Curve # | a0 | loop count | error | total mass |
| 1 | 2 | 8 | 24 | 8,942 | 58447645 |
| 2 | 2 | 0.8 | 24 | 8,942 | 584476455 |
| 3 | 2 | 0.08 | 24 | 8,942 | 5844764551 |
What the test shows is that when you decrease a0 with a factor 10 the mass m0 is increased with a factor 10.
This behaviour is in agreement with the rule: v1 = SQR(SQR(G * m0 * a0)
This rule describes with v1 being constant when you decrease a0 with a factor 10, m0 should increase with a factor 10. And vice versa.
Important lesson: That by changing the Universal Constant a0 you can give the galaxy any mass value you like.
Galaxy rotation curve 2 and a0 - fixed mass
The purpose of this test is to demonstrate what happens with the rotation curve if you study the same mass distribution changing the parameter a0.
Starting point is rotation curve 2.
It is important that the parameter Loop count is set to -1, in order to prevent the mass calculation phase.
| Test | Curve # | Mond | a0 | M init | V 1 | V 10 | loop count | error | total mass |
| 1 | 2 | Off | 8 | No | 200 | 200 | -1 | | 130252103693 |
| 2 | 2 | On | 8 | No | 216 | 1554 | -1 | 2826 | 130252103693 |
| 3 | 2 | On | 0.8 | No | 122 | 874 | -1 | 1360 | 130252103693 |
| 4 | 2 | On | 0.08 | No | 68 | 491 | -1 | 542 | 130252103693 |
| 5 | 2 | On | 0.008 | No | 38 | 276 | -1 | 140 | 130252103693 |
| 6 | 2 | On | 0.0008 | No | 21 | 155 | -1 | 234 | 130252103693 |
What can you learn from the above test?
In the tests we keep the total baryonic mass constant. MOND is tetsted by modifying a0
- With Newtons'Law we get a flat curve with speed 200.0
- With MOND we get a curve which lies below this curve
- IMO what this means is to use MOND in order to explain dark matter is highly speculative.
Galaxy rotation curve 2, # stars, MOND versus Newton
The purpose of this test is to demonstrate what the difference is between Newton and MOND when the total number of stars is different
Starting point is rotation curve 2.
| Test | Curve # | # star | MOND | total mass | Mond | total mass |
| 1 | 2 | 25 | On | 119435874 | Off | 131093341851 |
| 2 | 2 | 50 | On | 58447645 | Off | 130252103693 |
| 3 | 2 | 100 | On | 29103195 | Off | 128614178511 |
| 4 | 2 | 200 | On | 14463346 | Off | 127071520697 |
What the results show is that the total mass of a Galaxy is independent of the number of stars when Newton is considered. This is as expected.
With Newton when the number of stars is increased with a factor of two, the mass of each star is decreased with a factor of two and this has no influence on the overall rotating curve of the galaxy.
For MOND the result is different. The total mass decreases when the # of stars increases.
With MOND when the number of stars is increased with a factor of two, the mass of each star is decreased with a factor of four, in order to explain that the total mass decreases with a factor of two and as such has no influence on the overall rotating curve of the galaxy.
At the same time if you assume that the total mass stays constant (like with Newton) than an increases in the number of stars with MOND will change the overall speed pattern of the Galaxy.
Galaxy Rotation Curve # 4
Galaxy Rotation Curve #4 is the most difficult to simulate.
Perform the following 6 simultions. "# ring" = 10. # star = 50
| Test | Curve # | MOND | C4 Con | v calc(5) | v calc(10) | v tar(10) | total mass |
| 1 | 4 | Off | 0.1 | 193.9 | 180.9 | 180.9 | 10284965033 |
| 2 | 4 | Off | 0.2 | 193.9 | 162.4 | 163.7 | 83112352313 |
| 3 | 4 | Off | 0.3 | 194.2 | 133.5 | 148.1 | 66460106429 |
| 4 | 4 | On | 0.1 | 191.7 | 193.9 | 180.9 | 96574836 |
| 5 | 4 | On | 0.2 | 175.7 | 175.7 | 163.7 | 90985630 |
| 6 | 4 | On | 0.3 | 166.5 | 166.5 | 148.1 | 89521680 |
In the first 3 simulations the parameter "MOND" = Off.
The parameter "c4 Con" controls the exponetial decrease of the curve after its maximum value.
The parameter "v calc(5)" and "v calc(10)" are the calculated velocities 0f resp "ring #5" and "ring #10". In test 3 "V calc (10)" is the smallest
The parameter "v tar(10)" is the target value of "ring #10".
- When you compare the tests 1,2 and 3 with "MOND" = Off the two parameters "v calc(10)" and "v tar(10)" the values are close
- When you compare the tests 4,5 and 6 with "MOND" = On the two parameters "v calc(10)" and "v tar(10)" the values are different. What is more "v calc(5)" and "v calc(10)" are the same, implying a flat curve. meaning that you cannot simulate Curve #4 using MOND
Extended disc with Newton - Curve #6
Curve #6 is special and resembles Curve #4. In this case the galaxy mass is directly calculated. This allows to compare the same mass distribution under different circumstances i.e the visibility of the stars.
| Test | #ring | #star | Mond |
Ext disk | Con C6 | V calc(4) | V calc(10) | dens nr | m (10) | Total mass |
| 1 | 10 | 50 | Off | 1 | 1 | 203.1 | 221.4 |
4.27 | 9196986029 | 144590730173 |
| 2 | 10 | 50 | Off | 1 | 1.6 | 199.5 | 190.2 |
2.34 | 5047412949 | 112955607832 |
| 3 | 10 | 50 | Off | 1 | 2 | 196.8 | 173.7 |
0.57 | 3383382080 | 97828179557 |
| 4 | 10 | 50 | Off | 1 | 3 | 190.0 | 144.1 |
0.57 | 1244676709 | 73078628956 |
| 5 | 20 | 50 | Off | 2 | 1 | 202.0 | 198.1 |
0.76 | 9196986029 | 199868406309 |
| 6 | 20 | 50 | Off | 2 | 1.6 | 199.0 | 177.3 |
0.23 | 5047412949 | 136172354007 |
| 5 | 20 | 50 | Off | 2 | 2 | 196.5 | 165.1 |
0.76 | 3383382080 | 111041615256 |
| 6 | 20 | 50 | Off | 2 | 3 | 189.9 | 140.9 |
0.23 | 1244676709 | 76459158127 |
- Test 1 demonstrates the observed galaxy rotation curve. the grc is almost flat.
- Test 2 shows the calculated grc. Test 2 is based on the observed stars and based on visibility the "observed" mass. The difference.
When you compare the two there is a missing matter of roughly 7 * 10^10 solar masses or roughly 50.
- In the following tests improved visibility is studied.
Test 3 shows the calculated grc when the number of observed stars and "observed" mass increases.
The amount of missing matter roughly 4 * 10^10 solar masses or roughly 28%.
- At the same time when the visibility is improved also the size of the disc increases.
Test 4 demonstrates the observed galaxy rotation curve.
- Test 5 demonstrates the observed galaxy rotation curve.
The amount of missing matter roughly 6.3 * 10^10 solar masses or roughly 31%.
Important lesson: When observation equipment improves the amount of missing matter to explain the observed galaxy rotation curve decreases.
Program Evaluation - With simulation
The following are tests are all done with a real simulation.
Starting point are the standard parameters.
Ater the message:
- Perform Simulation ?
-
Select Yes Command
In the following table are 6 tests. The parameter disp # is at the top right corner of the display form. The value 1 means that only 1 star in each ring is displayed.
| Test | Curve # | Ext Disk | Mond | disp # | # ring | # stars | chaos | loop count | error | total mass |
| 1 | 2 | 1 | Off | 100 | 10 | 25 | 60 | | | 131093341851 |
| 2 | 2 | 1 | On | 100 | 10 | 25 | 400 | 24 | 9,852 | 119435874 |
| 3 | 5 | 1 | Off | 100 | 10 | 25 | 90 | | | 121112362053 |
| 4 | 5 | 1 | On | 100 | 10 | 25 | 2000 | 29 | 0,138 | 185041948 |
| 5 | 2 | 1 | Off | 1 | 10 | 25 | 60 | | | 131093341851 |
| 6 | 2 | 1 | On | 1 | 10 | 25 | 400 | 24 | 9,852 | 119435874 |
| 7 | 5 | 1 | Off | 1 | 10 | 25 | 90 | | | 121112362053 |
| 8 | 5 | 1 | On | 1 | 10 | 25 | 2000 | 29 | 0,138 | 185041948 |
| 9 | 4 | 2 | Off | 2 | 20 | 30 | 90 | | | 532103053781 |
| 10 | 4 | 2 | On | 2 | 20 | 30 | 2000 | 29 | 0,138 | 1229720034 |
-
The tests 1 to 4 have a display number of 100. That means the simulation shows all the stars.
When you start each simulation you will observe that all the stars follow each other in circles.
This stabble pattern will continue for some time until you will observe that some stars will move away, are jected and "chaos" start at a certain angle. This angle is the parameter chaos in the above table. This chaotical pattern is strictly a behaviour of the accuracy of the simulation and not so much a physical phenomena. When you compare MOND with Newton than MOND is more stable.
A whole different issue is at stake in the tests 5 to 8. In that case only one star is displayed (because disp # = 1). In test 5 and 6 ( with curve # = 2) after the start of the simulation you will observe an almost flat galaxy rotation curve as expected.
The most difficult issue with MOND is that you cannot simulate the solar system.
A similar problem is that you cannot simulate a Galaxy Rotation curve which after the bulge reaches its maximum speed and than very slowly starts to decrease. In such a case with MOND the curve stays flat and there is no mass at all in the disc. This is a serious problem.
A whole different problem that when two stars merge with Newton this has almost no influence on the stars in its neighbourhood.
See also: Philosophical considerations about galaxy simulations
See also: Scientific American September 2015. How Einstein reinvented Reality
Feedback
None
Created 18 August 2015
Updated 10 Februari 2016
Back to my home page: Contents of This Document